Analysis of Chess Opening Moves
Co-author: Cedric Conol
Executive Summary
The study aims to determine the relationship between different types of chess opening move and the outcome of the game using data scraped from Chessgames by testing different hypotheses. Chessgames is a website compiling thousands of chess games records, which can be accessed and reviewed by any user online. Opening moves, player info and statistics were scraped from Chessgames using Python's BeautifulSoup library. Using HTML parser, the desired information were extracted with the use of HTML tags and were stored in a SQLite3 database. Variables to be tested were obtained from the database and cleaning of datasets using different data wrangling techniques then followed. Different hypotheses were tested using statistical methods to determine any significant relationships among variables. The dependency of the result of the game to the types of opening move was tested using the Chi-Square Test of Interdependence. A p-value of 0 was obtained with a significance level of 0.05 thus, the $H_0$, which states that the game result is independent of the opening move, was rejected. The chance of getting a fair result (win, lose or draw) of one opening move among different players was tested using Chi-Square Goodness of Fit Test. A p-value of 0.00 was obtained, rejecting the $H_0$ which states that for a specific opening move, there is an equal chance of getting a fair game result. Lastly, it was observed that the relationship of the frequency of using a type of opening move is not linearly related to the winning percentage of the move using Pearson Correlation. Results show that the chess game result is significantly dependent on the type of opening move and the type of opening move has a significant effect on the probability of winning a game but effect is not linear. Thus, it can be concluded that the type of opening move can have advantages and disadvantages on the game. Findings of the study can be used in further studies especially on developing Chess AI however, analysis of more variables such as black opening move and the player's first five moves should be done to generate more significant results.
Introduction
About the game
Chess, originated in the 6th century, is a game played on a board of 64 squares by two players. One player is in control of the white pieces, and the other player is in control of the black pieces. The player controlling the white pieces is often simply referred to as "white" and the player controlling the black pieces is often simply referred to as "black". Each player gets eight pawns, two knights, two bishops, two rooks, one queen and one king. The board below shows the starting position for standard chess.
Algebraic Notation
The 64 squares are arranged in eight vertical rows called files and eight horizontal rows called ranks. These squares alternate between two colours: one light and the other dark. The eight ranks are numbered 1 through 8 beginning with the rank closest to the white player. The files are labeled a through h beginning with the file at White’s left hand. Each square has a name consisting of its letter and number, such as b3 or g8.
Goal of the Game
The goal of chess is to trap the enemy king up to the point that it cannot avoid being captured. The white player always goes first followed by black. Each player would take turns moving 1 piece per turn (click here for moves of each piece). No one is allowed to "pass" on a turn. The game is won when one king is in 'check' and cannot avoid capture on the next player's move; this is called checkmate. A game also can end when a player acknowledges his or her defeat by resigning. It is also possible for the game to end in a draw, that's when a player is not in check but has no legal moves.
Problem Statement
A famous theory in chess states that white begins the game with some advantage which is why analysts and players give focus to the white player's opening move to the point of give specific names to these moves. Several theories and publications have been published to analyze the importance of the first move. This study intends to determine the statistical significance of the different opening moves in winning a game. Public records available on <a href = http://www.chessgames.com/>Chessgames.com</a> will be used to analyze the interdependence of the opening moves with the results of the game, the relationship between the type of opening move used and its winning percentage and lastly, to determine if there's equal chance of winning, losing or getting a draw in a game. The study will only focus on all data of white players along with the opening moves found at Chessgames.com.
Research Questions
The following questions will serve as guide in the study:
- Is there a relationship between the type of opening move and the outcome of the game?
- Is there an equal chance of winning, losing and getting a draw for the most popular move?
- Is there a relationship between popularity of the opening move and win percentage of each move?
Methodology
To meet the said objectives of the study, dataset from Chessgames will be extracted and be used in the analysis. Python programming language will be used in extracting, wrangling and analysis of the data. Dataset will be extracted from Chessgames using Python's requests, urllib and bs4 libraries. The extracted data will then be stored in a SQLite3 database in the form of tables. From the database collected, exploratory data analysis will then be conducted to determine which data wrangling method to use in cleaning the data. Cleaned and processed data will be analyzed using different statistical methods namely Chi-Square Test of Interdependence, Chi-Square Goodness of Fit Test and Pearson Correlation to determine if there are significant relationships among variables. Details of each method will be explained in a separate section below.
Python Libraries
The following libraries and modules were used in the analysis:
requests- standard library for making HTTP requests in Pythonurllib.request- module used for opening and reading URLsBeautifulSoup- library that makes it easy to scrape information from web pagespandas- tool for data manipulation and analysisnumpy: fundamental package for scientific computingmatplotlib.pyplot- plotting library for Pythonplotly: graphing library to build interactive, publication-quality graphssqlite3- library that provides a lightweight disk-based database that doesn’t require a separate server process and allows access to a databaseos- module that provides a portable way of using operating system dependent functionalitytime- module that provides various time-related functionsscipy.stats- module to be used in different statistical tests
import requests
import urllib.request
from bs4 import BeautifulSoup
import pandas as pd
import numpy as np
import re
import matplotlib.pyplot as plt
import plotly.graph_objs as go
import plotly.offline as py
py.init_notebook_mode(connected=True)
import sqlite3
import os
import time
import scipy.stats

os.environ['HTTP_PROXY'] = 'http://13.115.147.132:8080'
os.environ['HTTPS_PROXY'] = 'http://13.115.147.132:8080'
Data Description
Chessgames is an online repository of chess game database. Users can freely access the a vast lake of information such as tournaments showing all the moves of each player, players with respective statistics such as over-all win percentage, years of playing chess, highest rating achieved, most played openings, notable tournaments and recent games, record of World Chess Championship and opening move types.
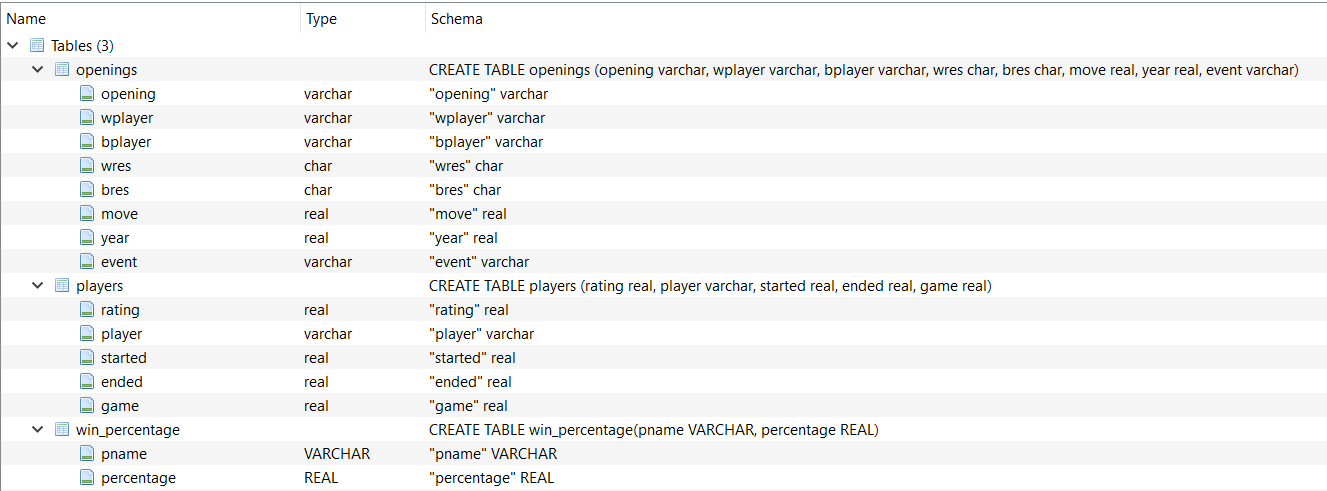
In this study, the following information were scraped and were stored in SQLite 3 database:
Database Creation
Before scraping the data from the website, the database should be established first. SQLite3 library was used in creating the database. A Connection object conn that represents the database should be created first. The data will then be stored in the chess.db file.
Once the Connection object had been established, Cursor object c was created to perform different SQL commands using the method execute(). To save any changes made on the database, commit() method was called along with the Connection object.
Creating chess.db database with players table
# database name: chess.db
# table name for players: players

conn = sqlite3.connect('chess.db')
c = conn.cursor()
c.execute('''CREATE TABLE players
             (rating real, player varchar, started real, ended real,
             game real)''')
conn.commit()
Create table for openings
# table name for players: openings

c.execute('''CREATE TABLE openings
             (opening varchar, wplayer varchar, bplayer varchar, wres char,
             bres char, move real, year real, event varchar)''')
conn.commit()
Create table named win_percentage for the over-all win percentage of each player
# table name for players: win_percentage

c.execute('''CREATE TABLE win_percentage(pname VARCHAR, percentage REAL)''')
conn.commit()
Web Scraping
Once the tables in the database are created, extracting of data will follow. Using Python’s requests library, the target url was opened and read.
The BeautifulSoup module of Python was used to extract the contents of the website in the form of a BeautifulSoup object. With the use of HTML parser, lxml, and HTML tags, selected strings were extracted from the BeautifulSoup object.
Store URLs for player directory
headers = {'user-agent': 'Mozilla/5.0 (Windows NT 10.0; Win64; x64) '
           'AppleWebKit/537.36 (KHTML, like Gecko) Chrome/74.0.3729.169'
           ' Safari/537.36'}

urls = []
for letter in 'ABCDEFGHIJKLMNOPQRSTUVWXYZ':
    urls.append('http://www.chessgames.com/directory/{}.html'.format(letter))
Looping through all player directory URLs and storing data to players table
for url in urls:
    # request to server
    req = requests.get(url, headers=headers)
    soup = BeautifulSoup(req.text, 'lxml')
    namedir = soup.select('table')[6].select('tr')

    # parse response
    startrow = 3
    vals = []
    while True:
        try:
            # exclude table header
            if 'highestrating' in namedir[startrow].select('td')[0].text:
                startrow += 1
            else:
                r = (namedir[startrow].select('td')[0].text.strip())
                p = (namedir[startrow].select('td')[2].text.strip())
                y = (namedir[startrow].select('td')[3].text.strip())
                g = (namedir[startrow].select('td')[4].text.strip())
                if '-' in y:
                    s = y.split('-')[0]
                    e = y.split('-')[1]
                else:
                    s = y
                    e = ''
                tup = (r, p, s, e, g.strip(','))

                # append to vals if row is complete
                if '' not in tup:
                    vals.append(tup)
                startrow += 1
        except:
            break
    # insert into players table
    c.executemany("INSERT INTO players VALUES (?,?,?,?,?)", vals)
    conn.commit()
Get chess opening codes
opening_url = 'http://www.chessgames.com/chessecohelp.html'
opening_resp = requests.get(opening_url, timeout=1, headers=headers)
opening_soup = BeautifulSoup(opening_resp.text, 'lxml')
opening_table = opening_soup.select('table')
opening_df = pd.read_html(str(opening_table))[0]

# list of opening codes
eco = list(opening_df[0])
def opening_urls(eco):
    pagelist = []
    page_num = 1
    try:
        url = ('http://www.chessgames.com/perl/chess.pl?page='
               '{}&eco={}'.format(page_num, eco))
    except:
        url = ('http://www.chessgames.com/perl/chess.pl?page={}&playercomp'
               '=either&eco={}&result=1/2-1/2'.format(page_num, eco))
    req = requests.get(url, headers=headers)
    soup = BeautifulSoup(req.text, 'lxml')
    head = soup.select('table')[4].text
    lpage = int(re.findall(r'page\s1\sof\s(\d*);', head)[0])

    for page in range(1, lpage+1):
        pagelist.append('http://www.chessgames.com/perl/chess.pl?page='
                        '{}&eco={}'.format(page, eco))
    return pagelist
Get all records per opening move
for code in eco:
    try:
        pagelist = opening_urls(code)
        vals = []
        for page in pagelist:
            req = requests.get(page, headers=headers)
            soup = BeautifulSoup(req.text, 'lxml')
            head = soup.select('table')[5].select('tr')
            startrow = 1

            while True:
                try:
                    vs = head[startrow].select('td')[0].text
                    wp = re.findall(r'\.\s(.*?)\svs\s', vs)[0]
                    bp = re.findall('vs\s(.*)', vs)[0]

                    wl = head[startrow].select('td')[2].text.split('-')
                    moves = head[startrow].select('td')[3].text
                    year = head[startrow].select('td')[4].text
                    event = head[startrow].select('td')[5].text

                    tup = (code, wp, bp, wl[0], wl[1], moves, year, event)
                    vals.append(tup)

                    startrow += 1

                except:
                    break
    except:
        continue
    c.executemany("INSERT INTO openings VALUES (?,?,?,?,?,?,?,?)", vals)
    conn.commit()
    time.sleep(1)
Get winning percentage of each player
import string
letters = string.ascii_uppercase
base_url = 'http://www.chessgames.com/directory/'

# directory of URLS
dir_urls = []
for i in letters:
    dir_urls.append(base_url+i+'.html')

# player urls
player_urls = []
for url in dir_urls:
    player_resp = requests.get(url, headers=headers, timeout=10)
    player_soup = soup(player_resp.text, 'lxml')
    for link in player_soup.find_all('a'):
        if '?pid' in link.get('href'):
            player_urls.append(link.get('href'))

# extracting player data
base = 'http://www.chessgames.com'
for profile in player_urls:
    info_resp = requests.get(base+profile, headers=headers, timeout=10)
    info_soup = soup(info_resp.text, 'lxml')
    for x in info_soup.find_all('div'):
        win_percentage = re.search('\((.*)%\)', x.text).group(1)
    name = info_soup.find_all('p')[0].text.strip()
    c.execute("INSERT INTO win_percentage (pname, percentage)"
              "VALUES (?,?)", (name, float(win_percentage)))
    conn.commit()
Method of Analysis
Eploratory data analysis was done along with data wrangling was first done before statistical tests were conducted.
Exploratory Data Analysis
#check for most popular openings
freq = list(c.execute("""SELECT opening, COUNT(opening)
FROM openings GROUP BY opening"""))
freq = dict(freq)
df_freq = pd.DataFrame([list(freq.keys()), list(freq.values())]).T
per75 = np.percentile(np.array(df_freq[1]), 75)
#opening used at least 2284 times from the database
df_freq.columns = ['Opening Move','Number of Games']
df_freq.sum()
Opening Move       A00A01A02A03A04A05A07A08A09A10A11A12A13A14A15A...
Number of Games                                               920458
dtype: object
The generated statistics shows the total number of games stored in Chessgames.com. Out of all these games, the top 10 most popular opening moves and top 10 opening moves with the highest win percentage will be determined.
#75th percentile openings
df75 = df_freq[df_freq['Number of Games']>per75]
opening75 = list(df75['Opening Move'])
# fig, ax = plt.subplots(figsize=(13, 7))
# ax.boxplot([df_freq[1]]);

data = [go.Box(x=df_freq['Number of Games'], name = 'Opening Moves',
               marker=dict(color = 'rgba(71, 58, 131, 0.8)'))]
layout = go.Layout(width = 800, height=400,
                   xaxis=dict(title='Number of Games the Opening was used'),
                   title='Boxplot of Opening Moves by Number of Games Used')
py.iplot(go.Figure(data=data, layout=layout))
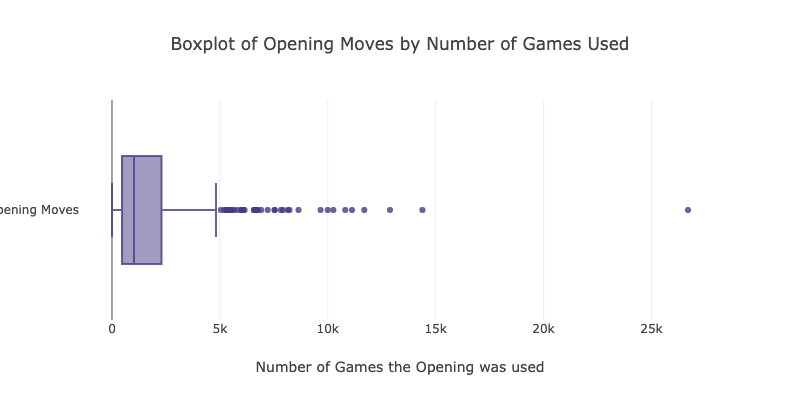
The figure above shows the frequency distribution of different opening moves where the dots represent the types of opening move. It can be observed that 50% of the openings were used 1018 times.
# top 10 most most used opening
top_freq = df75.sort_values(by='Number of Games', ascending=False)
highlight = 'rgba(71, 58, 131, 0.8)'
greyed = 'rgba(190, 192, 213, 1)'

data = [go.Bar(x=top_freq[:10]['Number of Games'][::-1],
               y=top_freq[:10]['Opening Move'][::-1], orientation='h',
               marker=dict(color=[greyed, greyed, greyed, greyed, greyed,
                                  greyed, greyed, highlight, highlight,
                                  highlight]))]
layout = go.Layout(width=600, height=500,
                   xaxis=dict(title='Number of Games Used'),
                   yaxis=dict(title='Openings'),
                   title='Top 10 Opening Moves by Number of Games Used')

py.iplot(go.Figure(data=data, layout=layout))
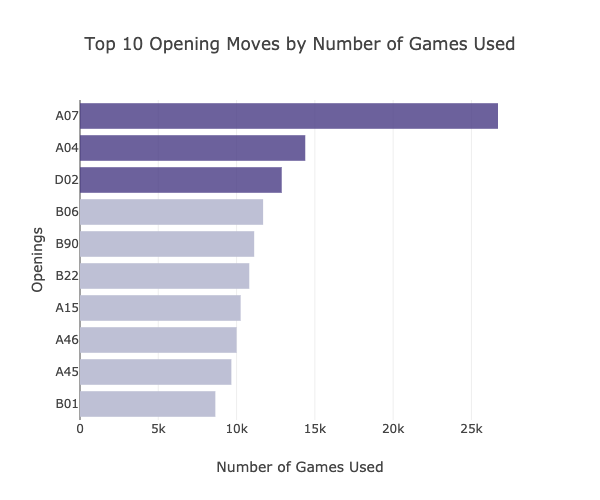
The top 10 most used opening moves are shown in the graph above. A07, commonly known as King's Indian Attack, is the most used opening move, having been used in more than 26,000 games.
One of the hypothesis that will be tested is if there is a significant relationship between the frequency of using an opening move and winning percentage. To test this, winning percentage of each opening will be obtained.
# opening per number of wins
win = list(c.execute("""SELECT opening, COUNT(opening)
FROM openings WHERE wres='1' GROUP BY opening"""))
opening_win = dict(win)
opening_win['B37'] = 0
opening_win['C06'] = 0

# opening per win percentage
win_per = []
for i in opening75:
    win_per.append(opening_win[i]/freq[i])

d = dict(zip(opening75, win_per))
s = [(k, d[k]) for k in sorted(d, key=d.get, reverse=True)]
top_win = pd.DataFrame(s, columns=['Opening Move', 'Win Percentage'])
top_win.describe()
| Win Percentage | |
|---|---|
| count | 124.000000 |
| mean | 0.375385 |
| std | 0.041223 |
| min | 0.276705 |
| 25% | 0.347788 |
| 50% | 0.373519 |
| 75% | 0.405286 |
| max | 0.512231 |
Win percentage statistics is shown in the table above. For this visualization, the dataset above the 75th percentile were used since there are some datasets which have 100% winning rate but only 2 games were played. However, in the analysis, we will consider the whole sample population in testing the hypothesis.
# 75th percentile opening ranked per win percentage
data = [go.Bar(x=top_win[:10]['Win Percentage'][::-1],
               y=top_win[:10]['Opening Move'][::-1],
               orientation='h',
               marker=dict(color=[greyed, greyed, greyed, greyed, greyed,
                                  greyed, greyed, highlight, highlight,
                                  highlight]))]
layout = go.Layout(width=600, height=500,
                   xaxis=dict(title='Winning Percentage'),
                   yaxis=dict(title='Openings'),
                   title='Top 10 Opening Moves by Winning Percentage')
py.iplot(go.Figure(data=data, layout=layout))
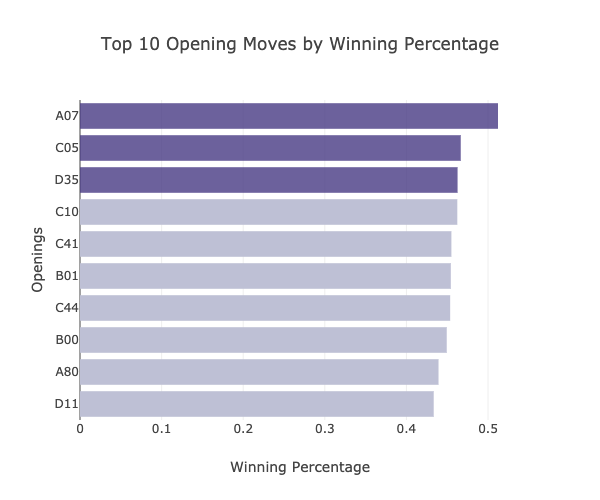
The plot above shows that A07, has the highest win percentage among the opening moves which were used in more than 2290 games (75th percentile). However, the succeeding opening moves are different compared to the results obtained for the commonly used opening moves.
Having the datasets needed for analysis, we can proceed to the hypothesis testing using different statistical methods.
Statistical Analysis
Different hypotheses will be tested on the variables obtained using a significance level $(\alpha)$ of 0.05 for all tests.
I. Chi-Square Test of Interdependence
This method intends to determine whether there are dependencies between the type of game result (win, lose or draw) and the type of opening move used. A contingency table between game results and opening type would show the frequencies for each game result per type of opening moves. The table is shown below.
Null Hypothesis: The type of game results is independent of the type of opening move used.
# opening per number of wins
win = list(c.execute("""SELECT opening, COUNT(opening)
FROM openings WHERE wres='1' GROUP BY opening"""))
opening_win = dict(win)

# opening_keys = [i.lower() for i in list(opening_win.keys())]
opening_win['B37'] = 0
opening_win['C06'] = 0
loss = list(c.execute("""SELECT opening, COUNT(opening)
FROM openings WHERE wres='0' GROUP BY opening"""))
opening_loss = dict(loss)
opening_loss['B38'] = 0
opening_loss['D89'] = 0

# crosstab for chi square test for interdependence
df1 = pd.DataFrame(opening_win, index=[0]).T
df2 = pd.DataFrame(opening_loss, index=[0]).T
df_ct = df1.join(df2, lsuffix='x', rsuffix='y')
df_ct.columns = ['Win', 'Lose']
df_ct = df_ct.T
df_ct
| A00 | A01 | A02 | A03 | A04 | A05 | A07 | A08 | A09 | A10 | ... | E93 | E94 | E95 | E96 | E97 | E98 | E99 | a06 | B37 | C06 | |
|---|---|---|---|---|---|---|---|---|---|---|---|---|---|---|---|---|---|---|---|---|---|
| Win | 2900 | 1210 | 741 | 405 | 5347 | 1032 | 13674 | 192 | 868 | 1899 | ... | 108 | 1574 | 215 | 40 | 1413 | 406 | 364 | 2328 | 0 | 0 |
| Lose | 2588 | 1065 | 842 | 539 | 4082 | 667 | 6859 | 119 | 678 | 1866 | ... | 54 | 1091 | 150 | 18 | 881 | 294 | 241 | 1607 | 1 | 1 |
2 rows × 496 columns
II. Chi-Square Goodness of Fit Test
This test intends to determine if the probability distributions of the three outcomes are equal. However, due to limitation of time, only opening move A07 will be used since based from the EDA conducted, it is the most used opening move with the highest win percentage as well. Table showing the number of games where A07 was used as opening move with respective results is shown below.
Null Hypothesis: There is an equal probability of winning, losing and getting a draw in a game if A07 will be used as opening move.
a07 = list(c.execute("""SELECT opening, wres FROM openings WHERE
opening = 'A07'"""))
df_a07 = pd.DataFrame(a07)
df_a07[1].value_counts()
1    13674
0     6859
½     6162
Name: 1, dtype: int64
Naming convention of the statistics above:
1: win0: lose1/2: draw
III. Pearson Correlation Coefficient
This test aims to measure of the strength of the linear relationship between frequency of usage and winning percentage of opening moves. Whole sample population will be tested based on the data obtained from the database.
Null Hypothesis: There is no significant linear relationship (correlation) between the frequency of usage and winning percentage of opening moves in the sample population.
df_win_per = pd.DataFrame(d, index=[0]).T
df_win_per.columns = ['Opening Move']
df_75_win = df75.join(df_win_per, on='Opening Move', lsuffix='a', rsuffix='b')
df_75_win.columns = ['Opening Move', 'Number of Games', 'Winning Percentage']
df_75_win['Number of Games'] = pd.to_numeric(df_75_win['Number of Games'])
data = [go.Scatter(x=df_75_win['Number of Games'],
                   y=df_75_win['Winning Percentage'], mode='markers',
                   marker=dict(color=highlight))]
layout = go.Layout(width=600, height=500,
                   xaxis=dict(title='Number of Games'),
                   yaxis=dict(title='Winning Percentage'),
                   title='Scatterplot of Number of Games vs'
                   ' Winning Percentage')

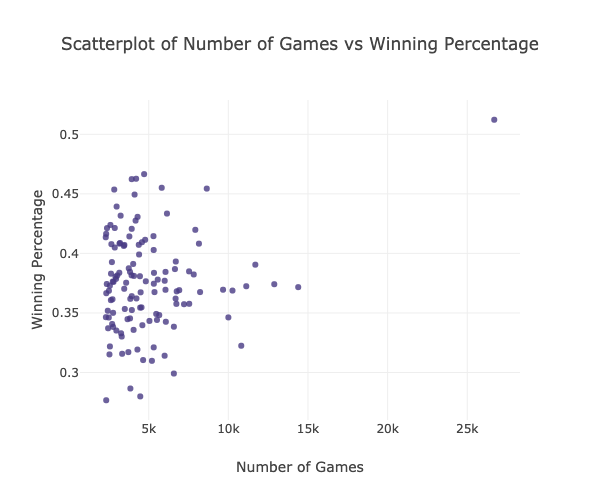
py.iplot(go.Figure(data=data, layout=layout))
The plot above shows the scatter plot of the number of games each opening move was played versus the winning percentage.
Results
I. Chi-Square Test of Interdependence
Two-sided test will be used to test the null hypothesis since directionality was not considered. For this test, scipy.stats chi2 and chi2_contingency modules will be used to compute for the degrees of freedom (dof), p-value and the chi-square test statistic.
from scipy.stats import chi2
from scipy.stats import chi2_contingency
chi2_stat, p_val, dof, ex = chi2_contingency(df_ct)
print("Chi-Squared Statistic: %s" % (chi2_stat,))
print("p-value: %s" % (p_val,))
# compute critical value using CI=0.95 and dof
prob = 0.95
critical = chi2.ppf(prob, dof)
# computed critical value is 547.87
print('DOF: ', dof)
if abs(chi2_stat) >= critical:
    print('Dependent on critical vlaue (reject H0)')  # 9031.31 >> 547.87
else:
    print('Independent on critical vlaue (fail to reject H0)')
Chi-Squared Statistic: 9031.307575019551
p-value: 0.0
DOF:  495
Dependent on critical vlaue (reject H0)
Since the P-value (0.00) is less than the significance level (0.05), the null hypothesis is rejected. Thus, it can be concluded that there is a relationship (dependency) between the different outcomes of a game and type of opening move.
II. Chi-Square Goodness of Fit Test
Again, two-sided test will be used to test the null hypothesis since the hypothesis just tests if the probability of each outcome os 0.3333. Using scipy.stats library, chisquare module will obtain the p-value and Chi-Squared statistic.
from scipy.stats import chisquare

N = len(df_a07[0])  # number of games
E = [N/3, N/3, N/3]  # 3 possible game result (w,l,d)
O = list(df_a07[1].value_counts())  # observed outcomes (order: l, w, d)

# null: equal game result share between w,l and d

chisq, p_val = chisquare(O, E)
print("Chi-Squared Statistic: %s" % (chisq,))
print("p-value: %s" % (p_val,))

ppoint = 5.99
if abs(chisq) >= ppoint:
    print('Reject H0')  # 1.89 >> 5.99
else:
    print('fail to reject H0')
Chi-Squared Statistic: 3871.8927889117813
p-value: 0.0
Reject H0
Since the P-value (0.00) is less than the significance level (0.05), the null hypothesis is rejected. Thus, it can concludes that the probabilities of winning, losing and getting a draw differ from each other.
III. Pearson Correlation Coefficient
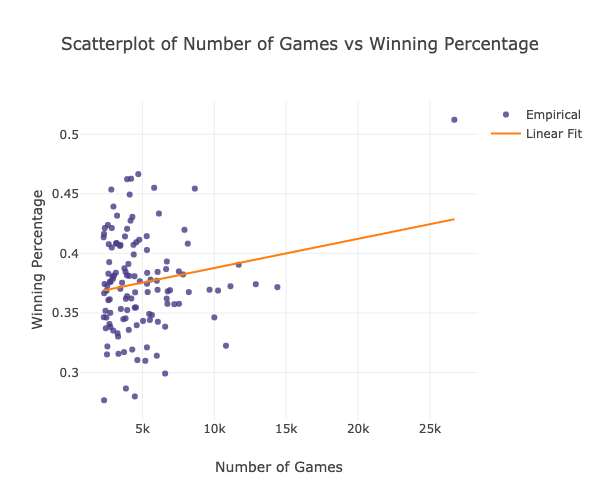
From the original population sample, the generated linear fit is shown below.
x=df_75_win['Number of Games']
y=df_75_win['Winning Percentage']
line = np.polyfit(x,y, deg=1)

data = go.Scatter(x=x, y=y, mode='markers',
                  marker = dict(color=highlight), name='Empirical')
reg_line = go.Scatter(x=x, y=line[0]*x+line[1], name='Linear Fit')
layout = go.Layout(width = 600, height=500,
                   xaxis=dict(title='Number of Games'),
                   yaxis=dict(title='Winning Percentage'),
                   title='Scatterplot of Number of Games vs'
                   ' Winning Percentage')

py.iplot(go.Figure(data=[data, reg_line], layout=layout))
pearson_correl = df_75_win['Number of Games'].corr(
    df_75_win['Winning Percentage'])
print('Pearson Correl: ', pearson_correl)
Pearson Correl: 0.18218578491300969
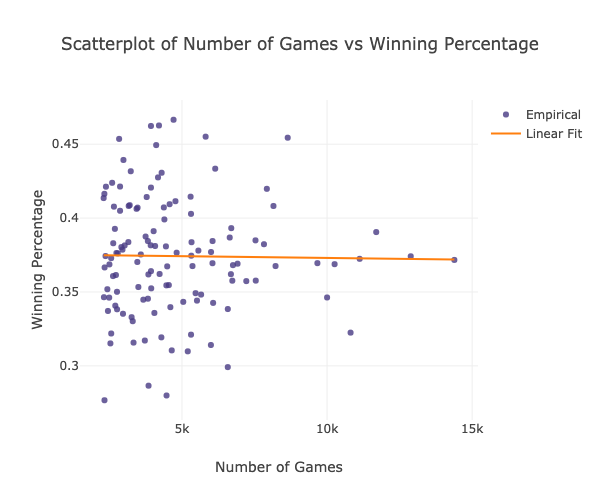
Since the Pearson correlation coefficient is very sensitive to extreme data values, A07 data point will be removed since it can greatly change the value of the coefficient.
# df_75_win.plot.scatter(x='Number of Games', y='Winning Percentage')
df_75_win_2 = df_75_win.drop(6)

x=df_75_win_2['Number of Games']
y=df_75_win_2['Winning Percentage']

line = np.polyfit(x,y, deg=1)

data = go.Scatter(x=x, y=y, mode='markers',
                  marker = dict(color=highlight), name='Empirical')
reg_line = go.Scatter(x=x, y=line[0]*x+line[1], name='Linear Fit')
layout = go.Layout(width = 600, height=500,
                   xaxis=dict(title='Number of Games'),
                   yaxis=dict(title='Winning Percentage'),
                   title='Scatterplot of Number of Games vs'
                   ' Winning Percentage')

py.iplot(go.Figure(data=[data, reg_line], layout=layout))
pearson_correl = df_75_win_2['Number of Games'].corr(df_75_win_2['Winning Percentage'])
print(pearson_correl)
-0.01451891536104693
From the obtained results, we can conclude that there is insufficient evidence to conclude there is a significant linear relationship between the frequency of usage of an opening move and its winning percentage the correlation coefficient is not significantly different from zero (less than 0.5). In addition, as seen in the plot above, the points fall randomly on the plot, which indicates that there is no linear relationship between the two variables.
Conclusion
The results show that there is significant relationship, specifically dependency, between the different outcomes of a game and type of opening move based on Chi-Square Test for Interdependence. Thus, it can be concluded that the result of a chess game has a significant dependency on the opening move. However, the effect whether positive or negative outcome was not determined in the two-tailed test.
There is also unequal probability of winning, losing and getting a draw in a game for the A07 opening move. This means that if a player chooses A07 as opening move, it can have a advantage or disadvantage in the game. Directionality was not determined since two-tailed test was used in hypothesis testing.
Lastly, there is no significant linear relationship between the frequency of use of a particular opening move and winning percentage. Results of the Pearson Correlation suggests a non-linear relationship between the two. This means that the opening move does not dictate the outcome of the game.
Recommendations
Based on the results obtained, the following recommendations are suggested to further improve the study.
- Cleaning of dataset to remove outliers in order to generate more reliable results. Due to the limitation of the scope of the study, testing of outliers was not done.
- Consider to include black player statistics and perform two-way ANOVA to account for the effect of one move to another.
- Perform Chi-Squared Goodness of Fit test to other data points since the chosen data point is an outlier based on the scatter plot generated.
Acknowledgment
The success and final outcome of this project required a lot of guidance and assistance from the MS Data Science faculty particularly Professor Christian Alis and Engr. Eduardo David Jr. who granted permission to use all required equipment and the necessary materials to complete the tasks. Deep gratitude is also given to AIM's Analytics, Computing, and Complex Systems Laboratory for providing the opportunity to do the project work using the laboratory's supercomputer.
References
- Chessgames Services LLC 2001, accessed 05 Jun 2019 <http://www.chessgames.com>
- Valenzuela, J.F., Hypothesis Testing
- Statistics Solutions 2019, accessed 07 Jun 2019 <https://www.statisticssolutions.com/non-parametric-analysis-chi-square/>
